You have probably looked at a tennis ball. But have you looked at the entire tennis ball all at once? To do so you would have to flatten the tennis ball by applying enough force so that the sides would split and its round shape would change. The same thing would happen if you tried to look at a map of the world all at once. You would have to flatten a globe onto a piece of paper.
A globe can show size, shape, distance, and direction accurately in three dimensions, but turning that globe’s surface into a flat, that is, a two-dimensional map of the three-dimensional earth you would have to stretch some areas of the flat map. Mapmakers call this stretching distortion.

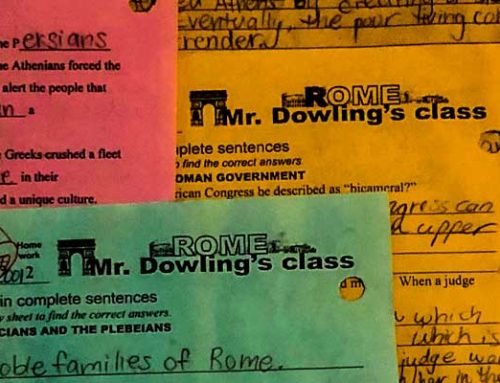
Flattened_earth
It is impossible to display a three dimensional object such as a globe on a flat surface.
A globe can show size, shape, distance, and direction accurately in three dimensions, but turning that globe’s surface into a flat, that is, a two-dimensional map of the three-dimensional earth you would have to stretch some areas of the flat map. Mapmakers call this stretching distortion.
For more than four hundred years, mapmakers have used mathematics to help them by creating algorithms that could translate the globe into a flat object. An algorithm is a set of rules for solving a problem.

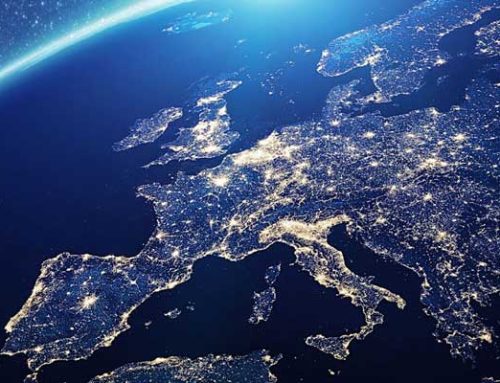
Marcator_Projection
On a Mercator Projection, parallels and meridians cross at right angles.
Flat world maps use algorithms to create a projection. A map projection is a way to show a drawing of the earth on a flat surface. All flat maps have distortion, so the shape, distance, direction, and land area can never be completely accurate. This distortion is a trade-off. But we accept the trade-off, since we use different map projections to meet various needs.
In 1569, Gerardus Mercator created a map where parallels and meridians cross at right angles. The so-called Mercator Projection is excellent for navigation because it shows direction clearly. The Mercator Projection, however, has a great deal of distortion. This is because to get the parallels and meridians to cross at right angles, Mercator created an algorithm that stretched the areas closer to the poles and squeezed the areas closer to the equator.

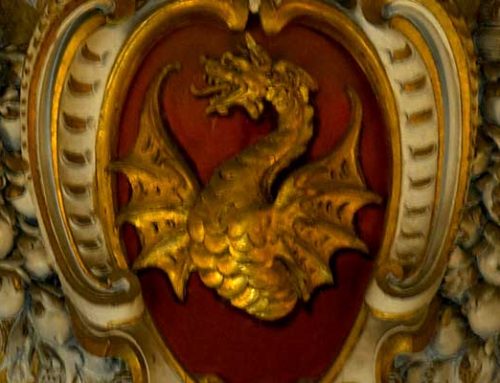
Equal_area_map
The Mollweide Projection is an example of an equal area map. An equal area map sacrifices accuracy of angle and shape in favor of accurate proportions in area.
An equal area map displays the shapes and sizes of things more accurately than a Mercator Projection. The Winkel tripel projection is one of several equal area maps. The Winkel tripel Projection sacrifices the accuracy of angle and shape in favor of accurate proportions in area. Tripel is a German word that translates as triple because the projection attempts to minimize distortion in area, direction, and distance.
Compare Greenland and Africa on the two projections. Africa is fourteen times larger than Greenland, but on a Mercator Projection, the two bodies of land appear to be about the same size.
Colorado and Wyoming look like rectangles on most map projections, but because of the earth’s curvature, the northern borders of both states are slightly more than twenty miles shorter than their southern borders. The border between the western United States and Canada is the longest straight border in the world. Some map projections depict the border as a straight line, while on other map projections, you will notice a slight bend due to the curvature of the earth.

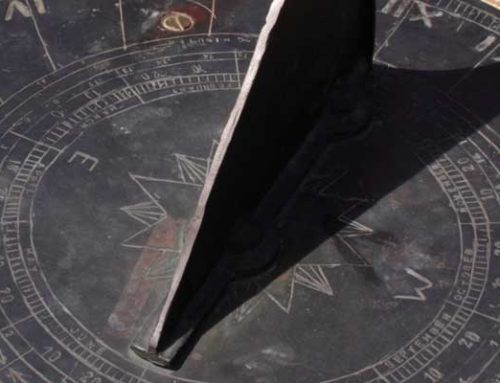
Gerardus_Mercator
Gerardus Mercator (1512-1594) is best known for creating a map where parellels and meridians cross and right angles. Mercator coined the term Atlas for a collection of maps.